


1. Introduction
The Peruvian coastal ocean is one of the most productive regions in the world. The water temperature along the Peruvian coast is cold because of upwelling, so primary productivity is high due to the nutrient-rich water. During an El Ni├▒o, however, the northern Peruvian coastal ocean temperature increases because warmer and less saline oligotrophic water comes down from the north. This change has an impact on fish resources such as anchovies that migrate to the south to escape the warm and oligotrophic water (Bertrand et al., 2008; Swartzman et al., 2008).
There are two types of pool in the tropical eastern Pacific; one is a warm (temperature > 27.5┬░C) pool and the other is a fresh (salinity < 34.0 psu) one (Fiedler and Talley, 2006; Kao and Lagerloef, 2015). The warm pool is centered along the coast of southwestern Mexico and Guatemala, and the fresh pool is located in the Gulf of Panama. This warm and fresh water can be differentiated from the cold and salt upwelled water on the Peruvian coast by the equatorial front. The equatorial front is normally located around the equator and moves southward during El Ni├▒o events (Kao and Lagerloef, 2015). When this happens, heavy rain and flooding follow in northern Peru. Therefore, monitoring the northern Peru is important for predicting fishing and weather catastrophes.
The Equatorial Undercurrent (EUC) flows eastward below the South Equatorial Current (SEC); it surfaces after passing 90┬░W and flows southeast, contributing to the Peru-Chile Undercurrent (PCUC) (Kessler, 2006; Montes et al., 2010). North of 5┬░S, the surface current known as the Ecuador-Peru Coastal Current (EPCC) flows southwest before the EUC feeds the PCUC (Chaigneau et al., 2013).
A Kelvin wave is a kind of non-dispersive long-period gravitational wave with an interface on one side along with the effect of the Earth's rotation. Kelvin waves proceed in the northern (southern) hemisphere with a coastline or the equator to the right (left). The El Ni├▒o-Southern Oscillation (ENSO) deepens the thermocline depth on the Peruvian coast, which is caused by coastal Kelvin waves coming up from the equator and traveling poleward (Kessler, 2006; Strub and James, 2002). These poleward Kelvin wave signals have been observed and analyzed along the South American continental shelf by using current meter moorings and sea level data (Brink, 1982; Hormazabal et al., 2002; Pizarro et al., 2001; Shaffer et al., 1997). However, no studies have made long-term current observations during an El Ni├▒o period on the northern coast of Peru.
The El Ni├▒o event in 2015-2016 was one of the strongest recorded El Ni├▒os according to the Multivariate ENSO Index (MEI) (https://www.esrl.noaa.gov/psd/enso/mei/). Based on the MEI, the 2015-2016 El Ni├▒o began in February and March 2015, then became stronger from April to May onward. The El Ni├▒o experienced a lull period in June and July, after which it increased in strength again until September 2015. Then, the El Ni├▒o decreased slowly in strength until March and April 2016. It weakened further in May and June before dissipating in July 2016. The purpose of this study is to explain the effects of the 2015-2016 El Ni├▒o on the coastal currents and temperatures on the northern coast of Peru by using data observed on the oil platform, and to investigate the causes of the abnormally strong currents.
2. Data and Methods
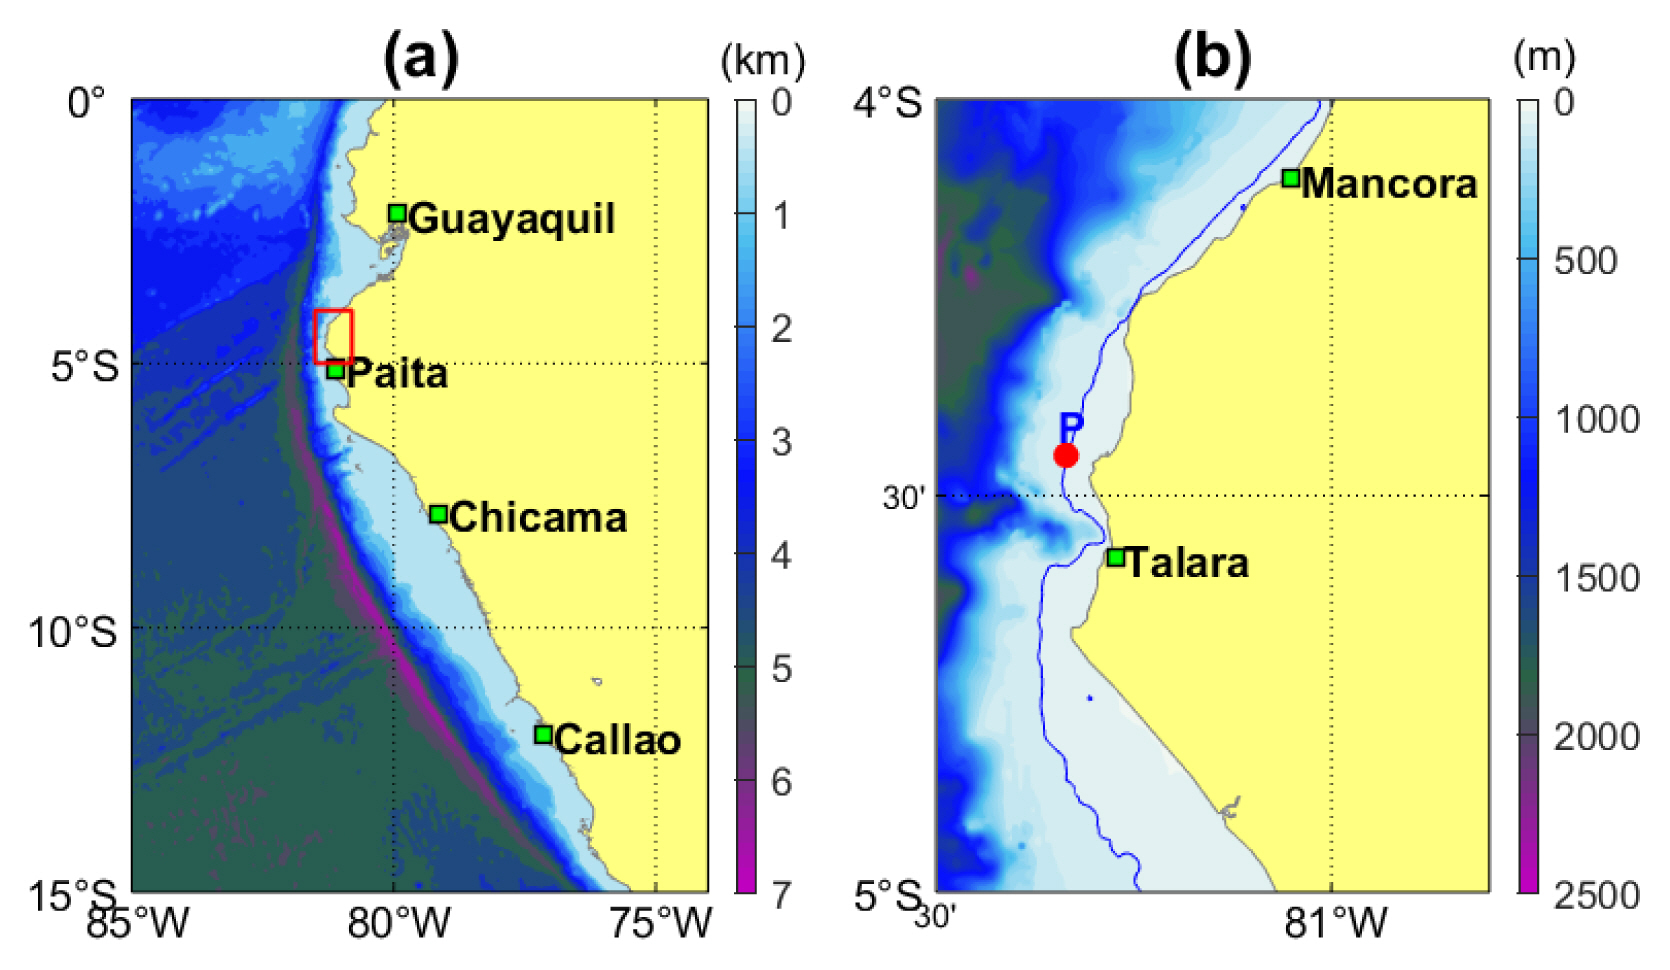
Temperatures and currents were measured using equipment moored on an oil platform (4┬░ 26.90' S, 81┬░ 20.13' W) off Talara, Peru (Fig. 1). The study area had a narrow continental shelf and steep continental slope. The bottom depth of the platform was 45 m at the center and approximately 50 m around the edge. A thermistor chain (RBRconcerto) with 3 m intervals was moored at the center of the platform to determine variations in the vertical thermal structure. An acoustic Doppler current profiler (ADCP, RDI WH300) was moored on the bottom about 80 m to the west of the platform. The sampling intervals were 10 minutes for the thermistor chain and 30 minutes for the ADCP. The equipment was deployed on 6 December 2014 and maintained until 27 May 2016, for one year and five months. However, as the thermistor chainŌĆÖs mooring line was lost, the thermistor chain data were only obtained until 30 December 2015. To obtain the daily data, a median filter was applied to the raw temperature and a 25-hour moving average to the raw current data.
To interpret the observation results, wind data, sea-level anomaly (SLA) data downloaded from the Copernicus Marine Environment Monitoring Service (http://marine.copernicus.eu/), and sea surface temperature (SST) data from the NOAA Earth System Research Laboratory (https://www.esrl.noaa.gov/psd/data/gridded/data.noaa.oisst.v2.html) were used. The wind data were estimated from the Advanced Scatterometer (ASCAT) and Oceansat-2 Scatterometer (OSCAT) retrievals, and from the European Centre for Medium-Range Weather Forecasts (ECMWF) operational wind analysis with a horizontal resolution of 0.25┬░ by 0.25┬░ every six hours. The SLA data distributed by AVISO with a resolution of 0.25┬░ were computed with an optimal and centered computation time window (six weeks before and after the observation date). Besides the moored temperature data, the SST at the nearest grid point to the platform was selected in the NOAA Optimum Interpolation (OI) SST V2 (Reynolds et al., 2002) to compare with the SLA. The sea surface temperature anomaly (SSTA) was calculated by subtracting the mean and trend from the SST from September 1981 to September 2017.
3. Results
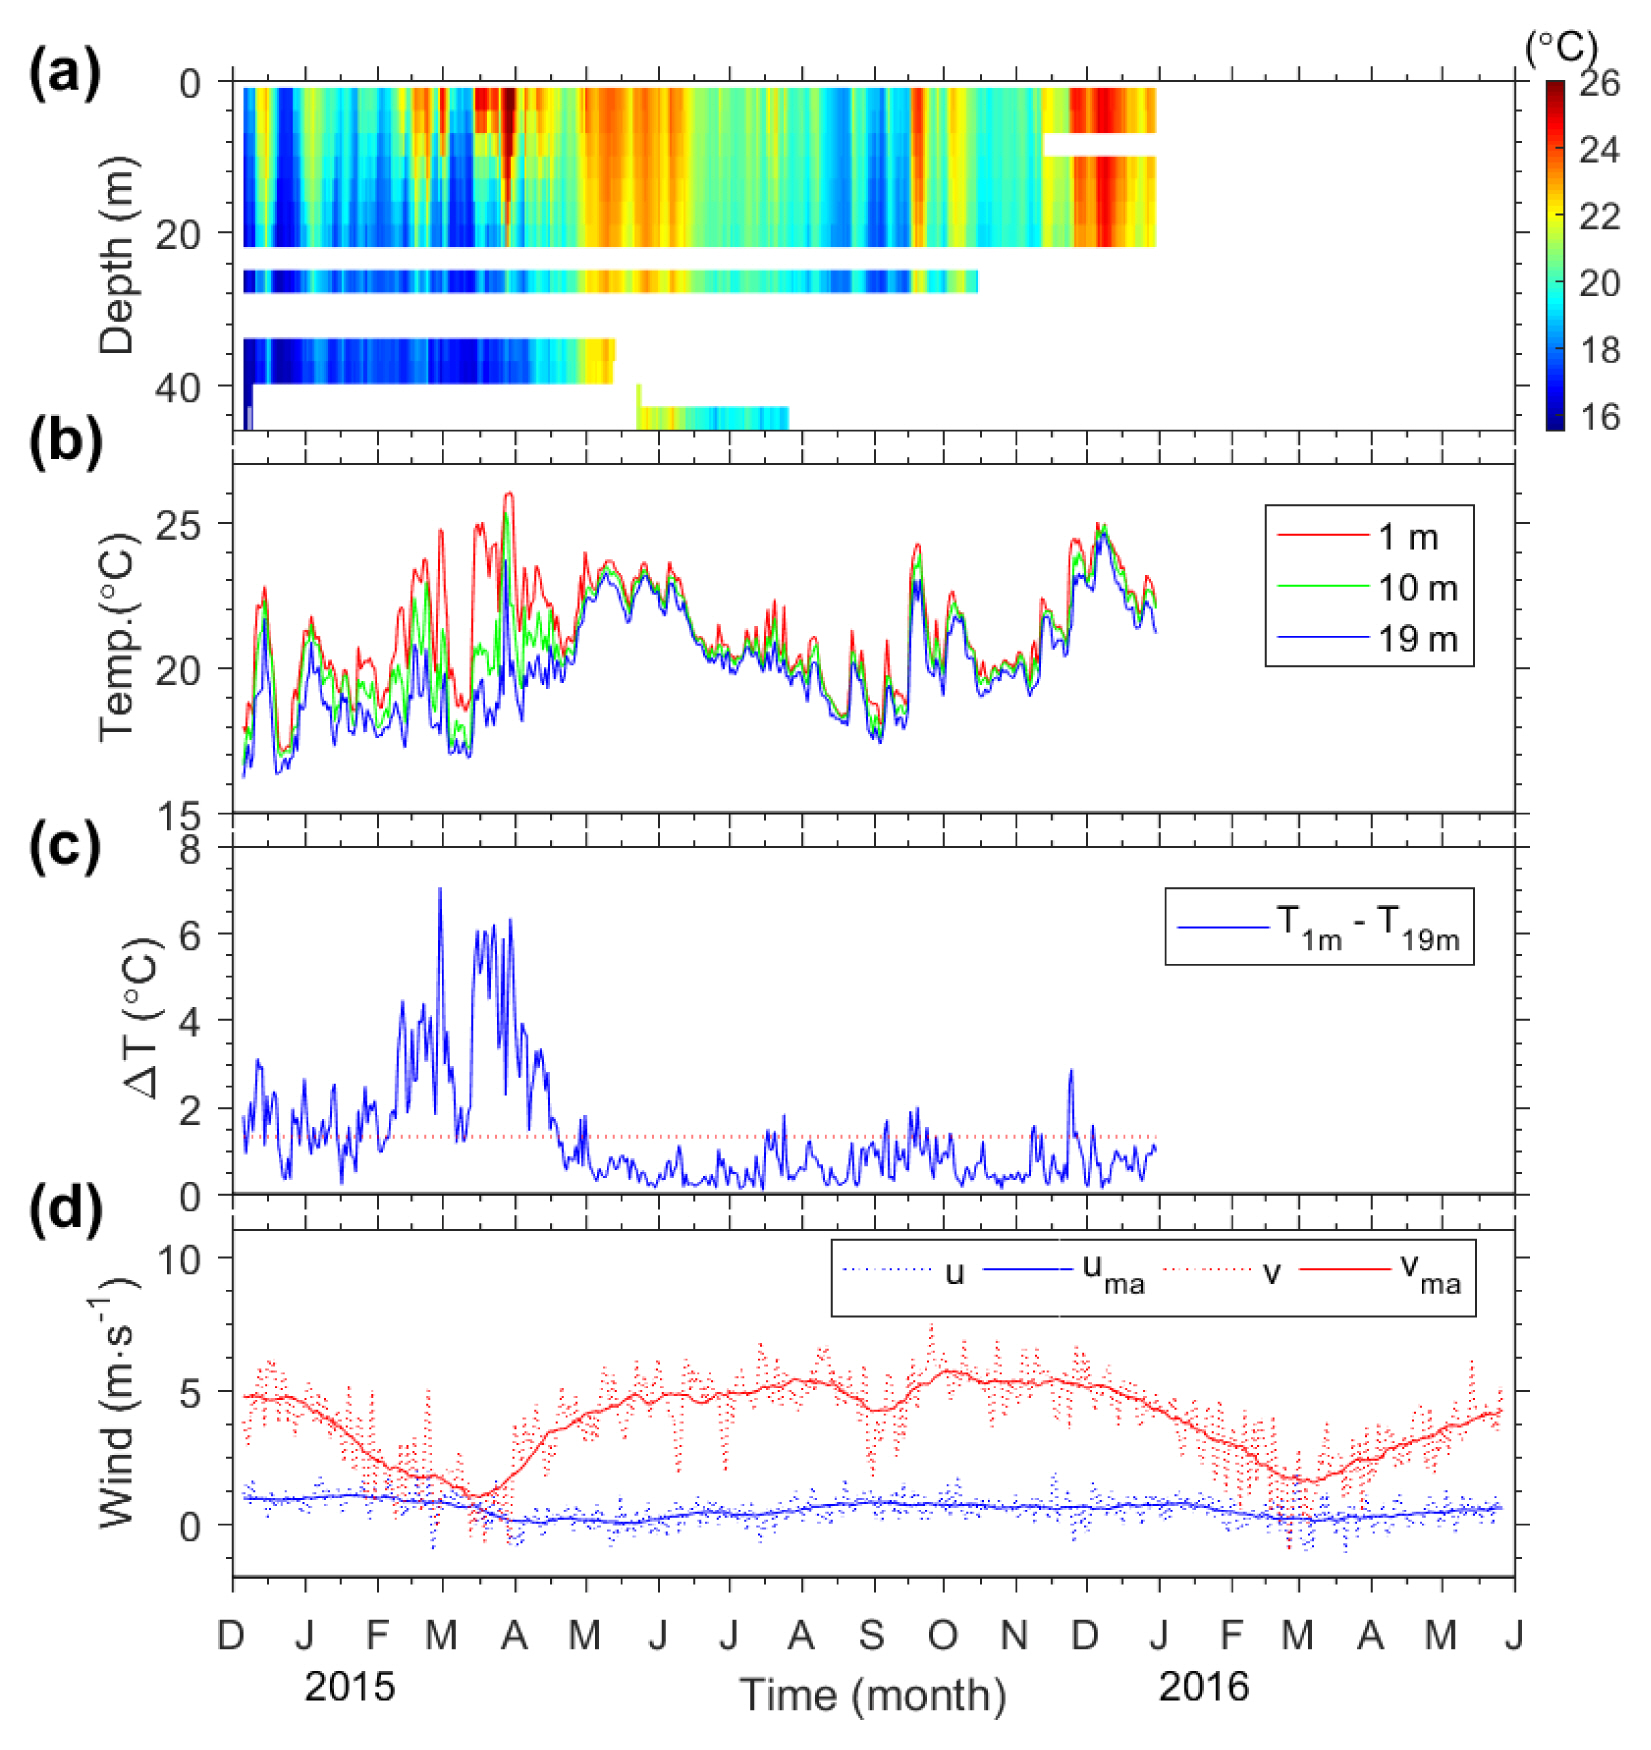
The vertical temperatures were observed from 1 m to 43 m using a thermistor chain with 15 channels spaced at 3 m intervals (Fig. 2a). However, the available data were only obtained from seven channels in the upper layer from 1 m to 19 m (Fig. 2b). The mean temperature and standard deviation in the upper layer decreased with depth from 21.33┬▒1.87┬░C at a depth of 1 m to 20.02┬▒1.85┬░C at a depth of 19 m. The average temperature difference between 1 m and 19 m was 1.31┬░C from December 2014 to January 2015, but it increased to more than 2┬░C from February to late April 2015 (Fig. 2c). Before 20 April 2015, the average temperature difference was 2.53┬░C, while after this date it was only 0.66┬░C. This means the mixed layer thickened after late April 2015. The daily wind blew consistently to the north, which was favorable for upwelling in this area during the temperature observation (Fig. 2d). However, the surface temperature did not drop when winds favorable to upwelling were blowing hard. During a period of light winds from February to mid-April 2015, the temperature difference increased because of stratification (Fig. 2c).
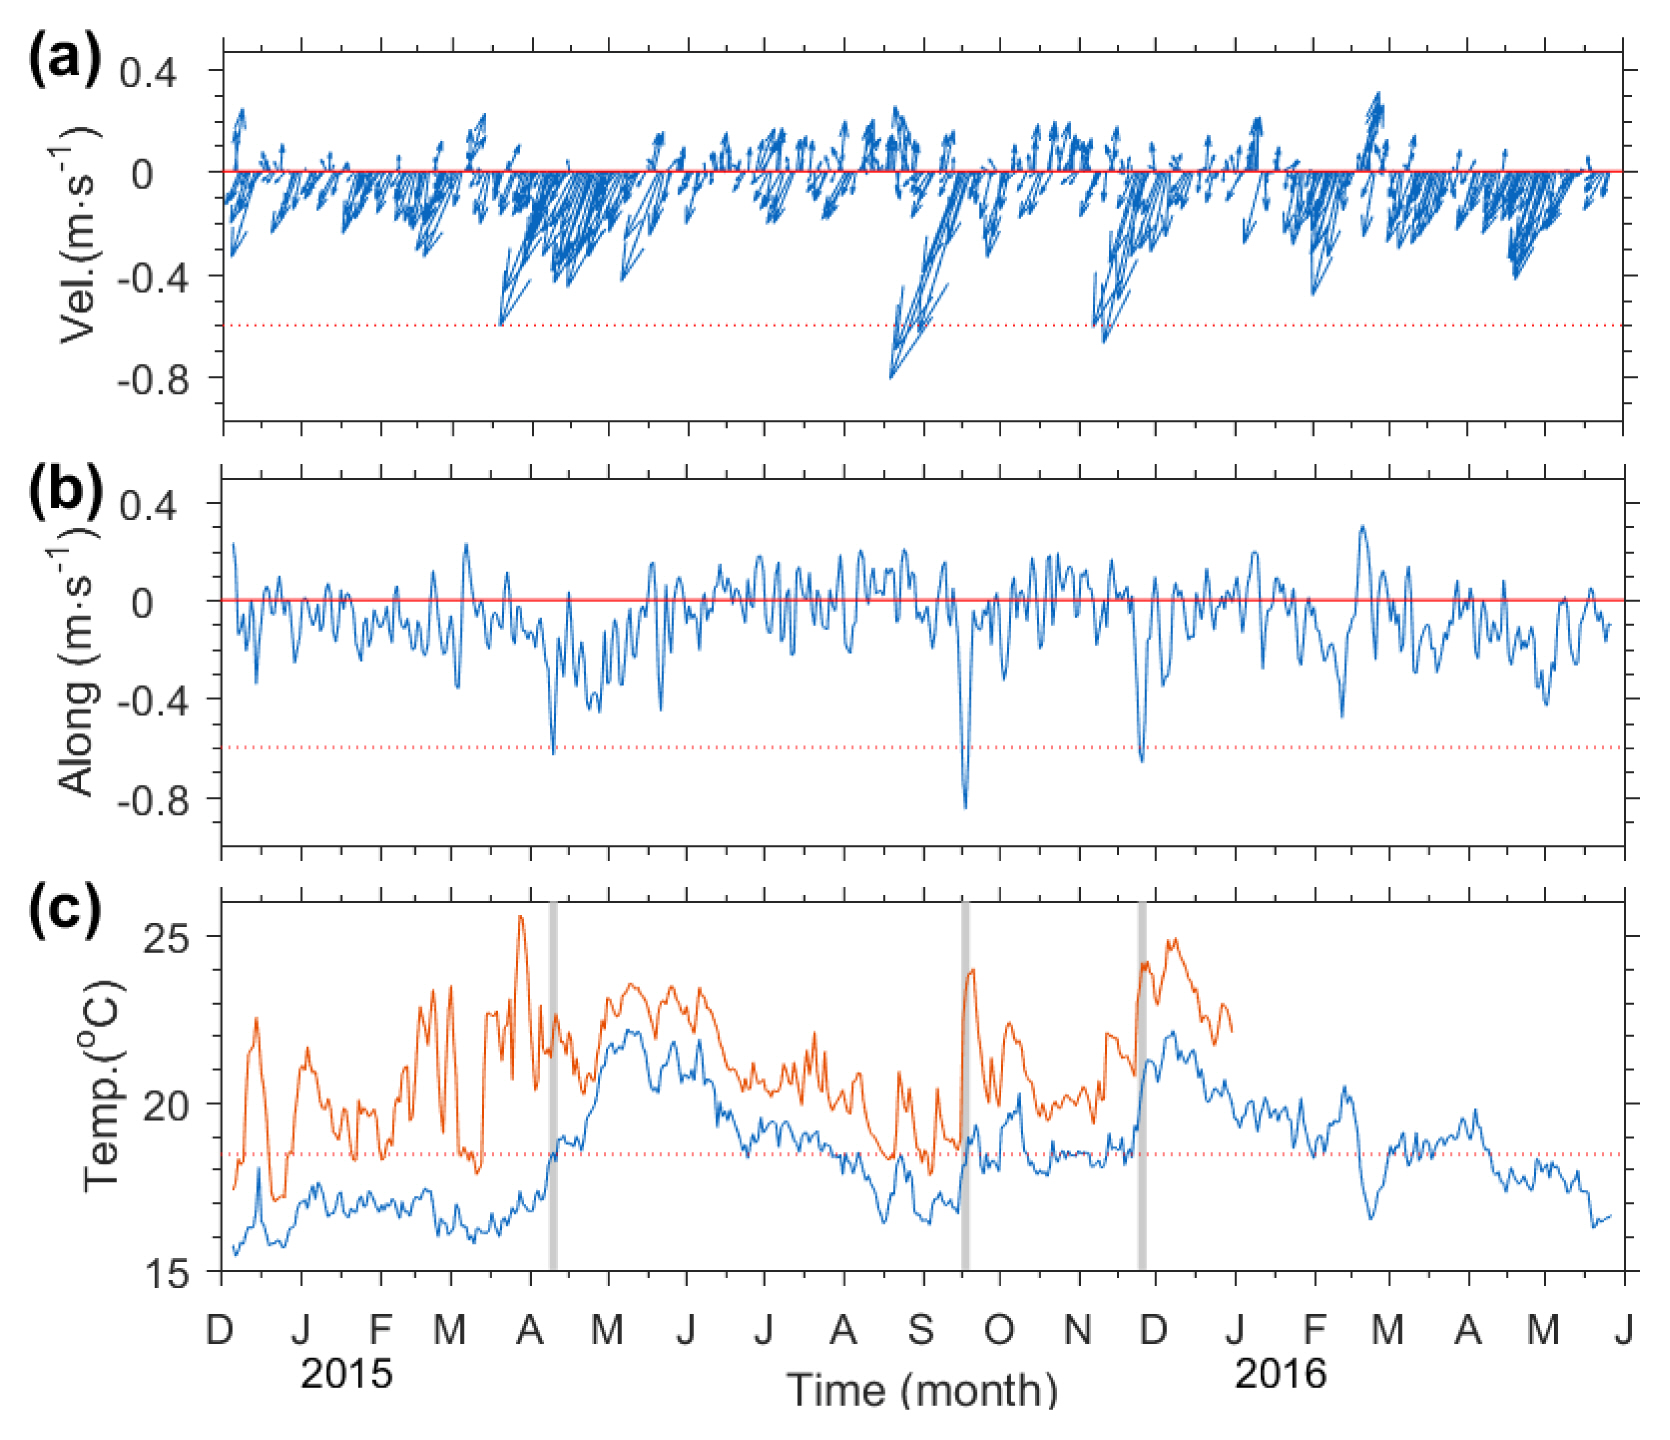
The mean and standard deviation of the current measured by ADCP varied vertically, mainly in the meridional component rather than the zonal component (Fig. 3a, b). The mean velocity and standard deviation of the zonal current were less than those of the meridional current. The mean velocity of the meridional component was at a maximum at medium depths (20-40 m in depth). However, the zonal mean current variation for depth was not as great as that of the meridional current. The standard deviation of the meridional component was at a maximum at the surface and at a minimum near the bottom, while the standard deviation of the zonal component was not as much as that of the meridional component. The averaged depth and time mean current flowed to the south-southwest at a rate of 0.10 m┬Ęs-1 (Fig. 4c). This current is the EPCC, as noted by Chaigneau et al. (2013). However, the mean current value was small compared with their results (0.20 to 0.30 m┬Ęs-1).
The current data were averaged by using a 25-hour moving average filter to eliminate the tidal currents. The upper layer (surface to 24 m depth) depth mean current vectors were mostly directed to the southwest (Fig. 4a). The current data transformed the direction of the mean current to clarify major axis variations. The south-southwest current component showed three strong current events faster than 0.60 m┬Ęs-1 (10 April, 18 September, and 26 November 2015) (Fig. 4b). Strong current events have never been reported in this area. After these strong current events, the bottom temperatures measured at the ADCP started to increase and reached their maxima about one month later. The surface and bottom temperatures changed simultaneously after the first strong coastal current event. This means the mixed layer deepened after the first event (Fig. 4c).
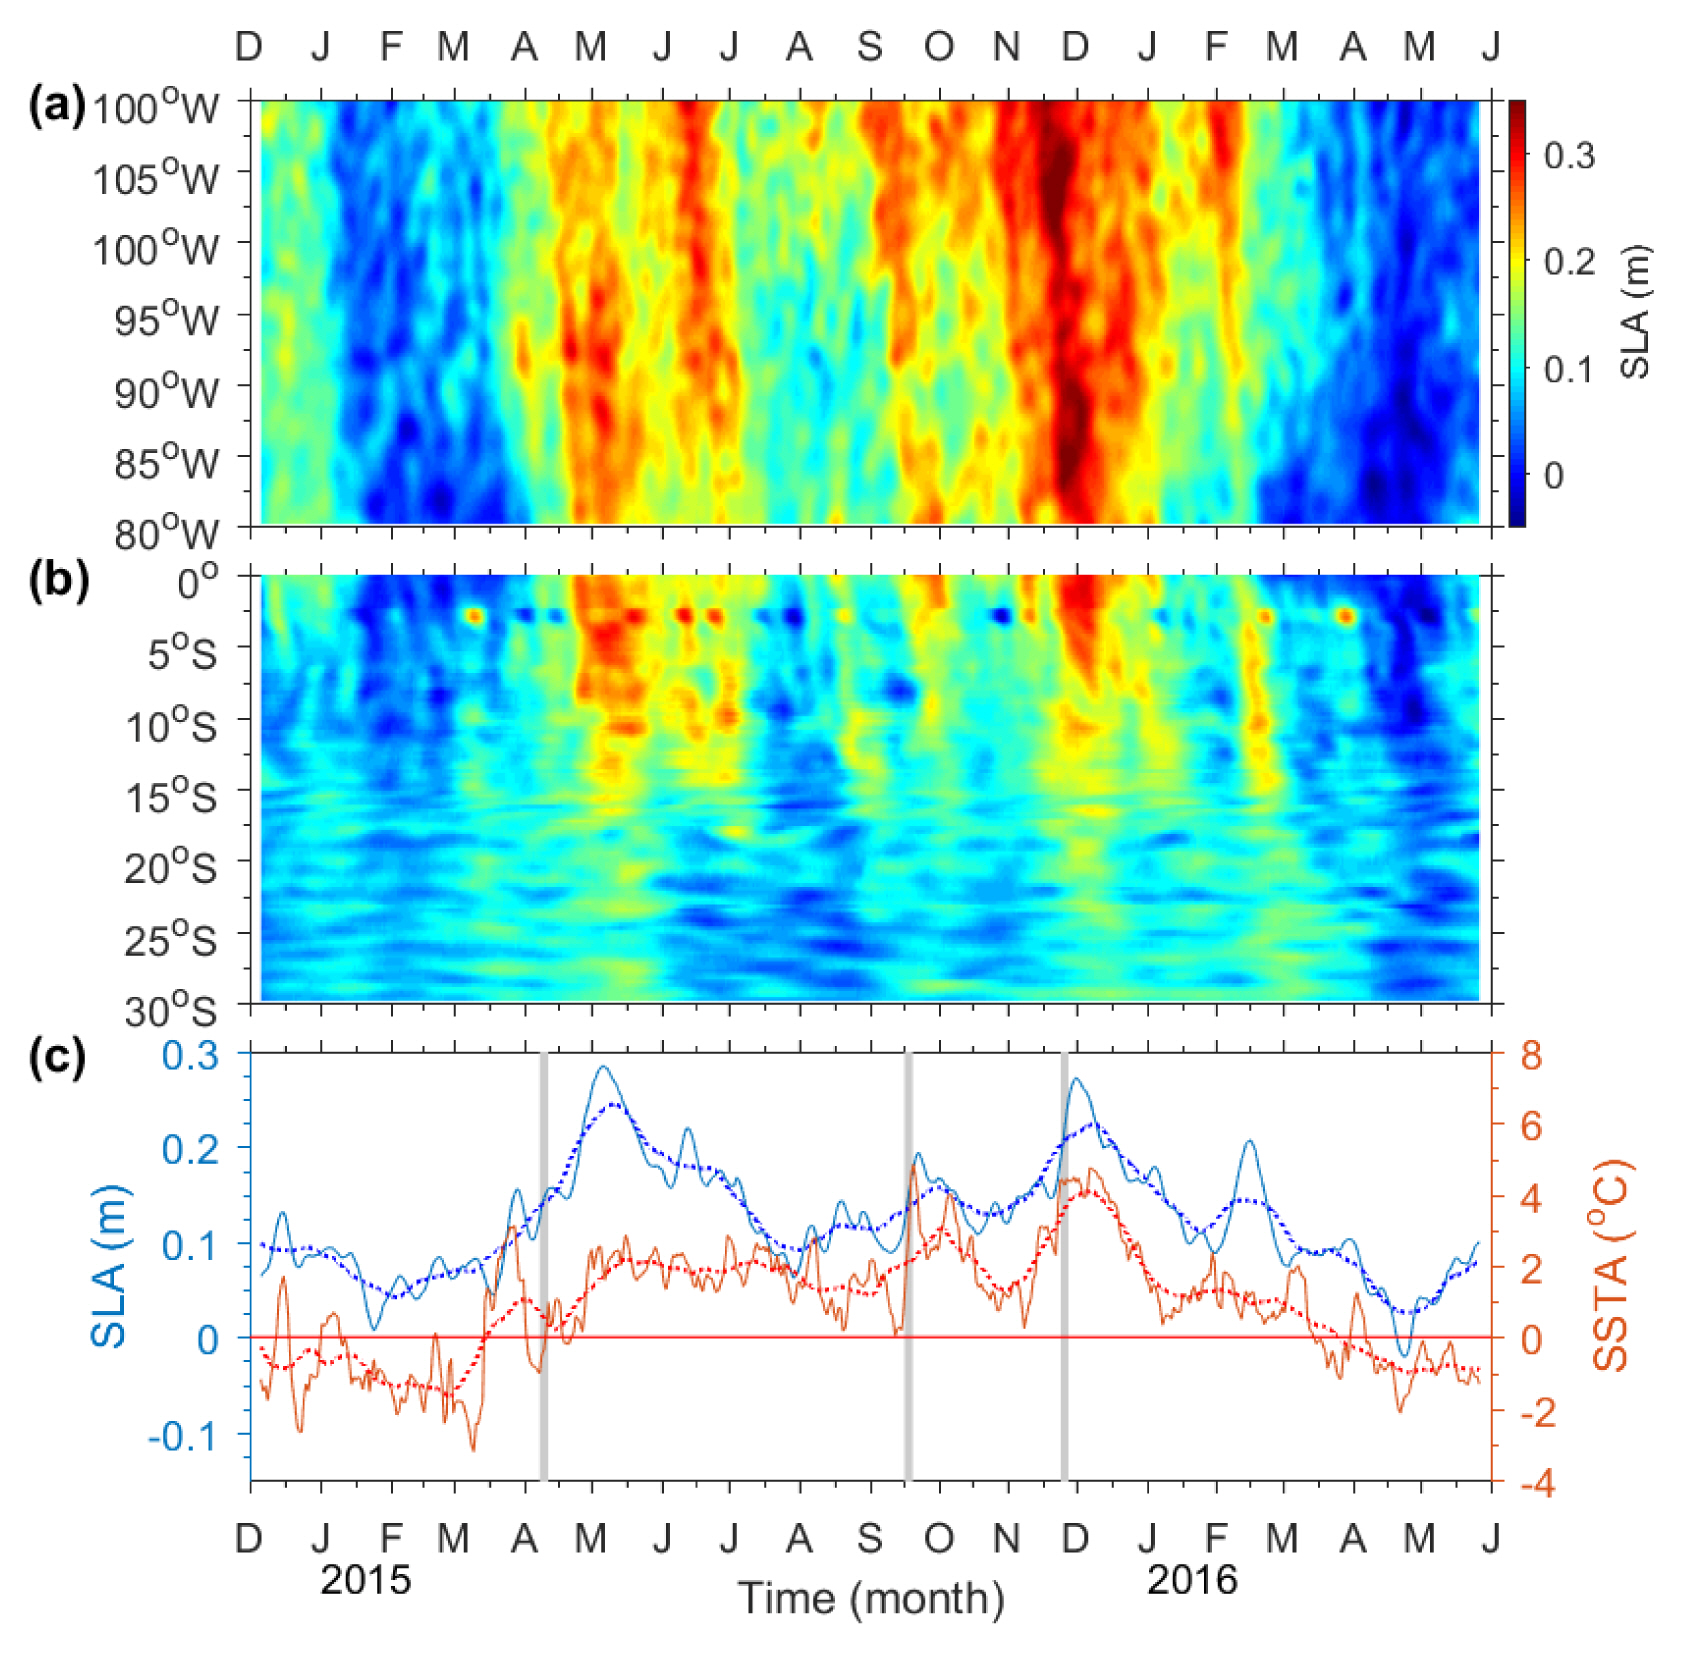
To show the propagation of the Kelvin waves, the sea level anomaly (SLA) data were analyzed for the same period of current observation (Fig. 5). Along the equator, the high SLA propagated from west to east and reached the South American coast during the El Ni├▒o period from April 2015 to February 2017 (Fig. 5a). Then, the high SLA propagated to the south along the coast (Fig. 5b). The three occurrences of the strong coastal current coincided with the start of the increasing SLA (Fig. 5c). This implies that the strong coastal current was caused by the propagation of the Kelvin waves from the equator to the south along the coast. The SSTA was correlated with the SLA near the mooring point. The correlation coefficients were 0.71 (p < 0.01) between the daily data and 0.83 between the 30-day moving averaged data. The moving averaged SSTA was positive from mid-April 2015 to late March 2016. This period was comparable to the span of the 2015-2016 El Ni├▒o based on the MEI.
4. Discussions
During the 2015-206 El Ni├▒o event, local winds could not explain the variations in the surface temperature and mixed layer thickness in the study region after late April 2015 (Fig. 2). Instead, the variations were due to the advection of warm water from near the equator and were associated with the passage of the coastal Kelvin waves traveling poleward. The warm water in the thickened mixed layer upwelled due to the upwelling favorable winds (Lav├Łn et al., 2006; Pennington et al., 2006). Therefore, local winds are not associated with surface temperature warming.
The depth mean current was slower than the average magnitude of the EPCC as suggested by Chaigneau et al. (2013). However, the strong coastal current speed was higher than the value they reported. The strong current only occurred when the SLA started to increase (Fig. 4, Fig. 5). Although the coastal current was strongest on 18 September 2015, the bottom temperature did not rise as much compared with April and November. This was probably related to the current speed after the strong coastal current events. In April, the current speed after the first event was as high as 0.20 m┬Ęs-1 for a month, but in September the current was weak after the second event.
The SLA changed simultaneously with the daily mean bottom temperature (Fig. 6a). The correlation coefficient was 0.75 (p < 0.01), which was higher than the coefficient between the SLA and SSTA. Therefore, the bottom temperature and the SLA had the same dominant power spectrum at a frequency of 0.004883 cycles per day (205-day period) (Fig. 6b). This period is longer than inertial and seasonal ones. However, the dominant frequency of the along-shore current was 0.01367 cycles per day (73-day period) (Fig. 6c), which was guessed to be a Kelvin wave frequency (Colas et al., 2008; Shaffer et al., 1997). The frequency of 0.004883 cycles per day was a second peak for the SLA and SSTA. The second peak corresponded to approximately three times the period of the coastal Kelvin waves. Further research is required on the cycle of coastal Kelvin waves, when strong coastal currents events.
5. Conclusions
An oil platform located on the northern Peruvian coast was used for mooring a thermistor chain and ADCP to monitor temperatures and currents. The data obtained from this mooring were analyzed to investigate the effects of the 2015-2016 El Ni├▒o on currents and temperatures on the northern Peruvian coast. Strong coastal currents were observed three times on 10 April, 18 September, and 26 November 2015. The upper layer mean strong coastal current speed was higher than 0.60 m┬Ęs-1, although the mean current speed was 0.10 m┬Ęs-1 flowing to the south-southwest. After the first strong coastal current event, the bottom temperature increased from approximately 18┬░C to 22┬░C, and the mixed layer deepened and remained there during the 2015-2016 El Ni├▒o. The surface and bottom temperatures reached their maxima about one month after the strong coastal currents, then decreased gradually. The wind near the mooring station blew consistently to the north, which was favorable for upwelling during the El Ni├▒o event. An analysis of the wind and sea surface height anomalies revealed that the deepening of the mixed layer was not related to local winds, but to coastal Kelvin waves which propagated from the equator during the El Ni├▒o event. In conclusion, the bottom temperature increased by advection from the north of equatorial waters through the Kelvin waves. Events such as this sudden bottom rise in temperature might threaten local benthic biota.


 PDF Links
 PubReader
 ePub Link
 Full text via DOI
 Download Citation
 Print
Print