Assessing the Erosional Properties of Muddy Sediments: Asan Bay Case Study
Article information
Abstract
The study’s outcomes reveal that both the critical shear stress needed to initiate erosion and the sediment erosion rate are influenced by various parameters, including the bulk density of sediment and bed shear stress. This comprehensive analysis underscores the vital role that these parameters play in determining sediment erosion characteristics. The presented research contributes to the understanding of erosional behaviors of muddy sediments and their implications. The findings emphasize the importance of comprehending such properties, especially in designing effective erosion control structures and managing water bodies prone to erosion.
1. Introduction
Coastal erosion is a significant concern for communities around the globe, and it is primarily determined by the stability or strength of the soil (Mohamed et al., 2021). Human activities and changes to the natural environment can disrupt the balance of coastal dynamics, such as waves, currents, and winds, leading to a loss of coastal zone sediments over time (Li et al., 2022; He & Silliman, 2019). This results in the destructive process of coastline retreat and beach erosion, as reported by Yincan (2017).
The force of flowing water, which exerts a flow shear stress on the soil surface, and the ability of the soil to resist erosion, both play a role in soil erosion, which is defined as the gradual removal of surface material from a soil mass by moving water. The resistance of a soil to shear failure is measured by its shear strength. According to the literature, the erosion resistance of cohesive soil is directly proportional to its shear strength (Sanford & Maa, 2001). When the flow-induced shear stress exceeds the shear strength of cohesive soil, erosion or removal of soil particles begins as the soil collapses. As a result, this shear stress is also known as the “critical shear stress” and serves as an indicator of the shear strength of cohesive soils (Pant, 2013).
The Asan Bay sea, situated approximately 48 km South-Southeast of Inchon, has a developing port with several ongoing land reclamation projects. It extends about 12.9 km West-Northwest from Nomi Gak (37°00′N., 126°47′E.) and has depths ranging from 7.3 to 23 m. The area, located about 3.2 km North of a line between Poseung Do and Imye Som, has tidal currents that flow East and West, shifting at around the times of high and low water at Inchon. The maximum velocity is 4 knots (Imagery & Agency, 2000). Data from 2012 shows that the area has an annual deposition rate of 22.2 cm/yr and 19.0 cm/yr for the LNG port and the outer port access route, respectively (Pyungtaek Province, 2014).
It is predicted that as development projects continue in the area, the sedimentation rate will increase to 27.8 cm/yr by 2030 (Pyungtaek Province, 2014). Based on research conducted by the Pyeongtaek Regional Maritime Affairs and Port Administration, it has been determined that deposition will occur throughout the water while erosion is expected to occur in the Poseung district and in front of the Hwaong Embankment.
Given the importance of coastal wetlands in the Asan Bay for economic, energy, and security reasons, understanding the cohesive soils that serve as the foundation for their sustainability and resilience is crucial in preventing erosion and land loss. Therefore, it is essential to study soil erosion and critical shear stress in the Asan Bay in order to maintain a healthy, sustainable, and stable wetland.
2. Site and Method of Sediment Sampling
A grab sampler was used to collect defined area of sediment (Fig. 1) from the ocean floor capable of collecting 5L on the ship. In addition, surface seawater was also gathered at the same location. This was done to ensure that the seawater conditions (Table 1) during the indoor experimental analysis accurately reflected those at the site of sediment collection. The collected seawater was used throughout the erosion experiment. A grab sampler and a Niskin water sampler used to collect sediment samples and sea water are shown in Fig. 2 respectively.
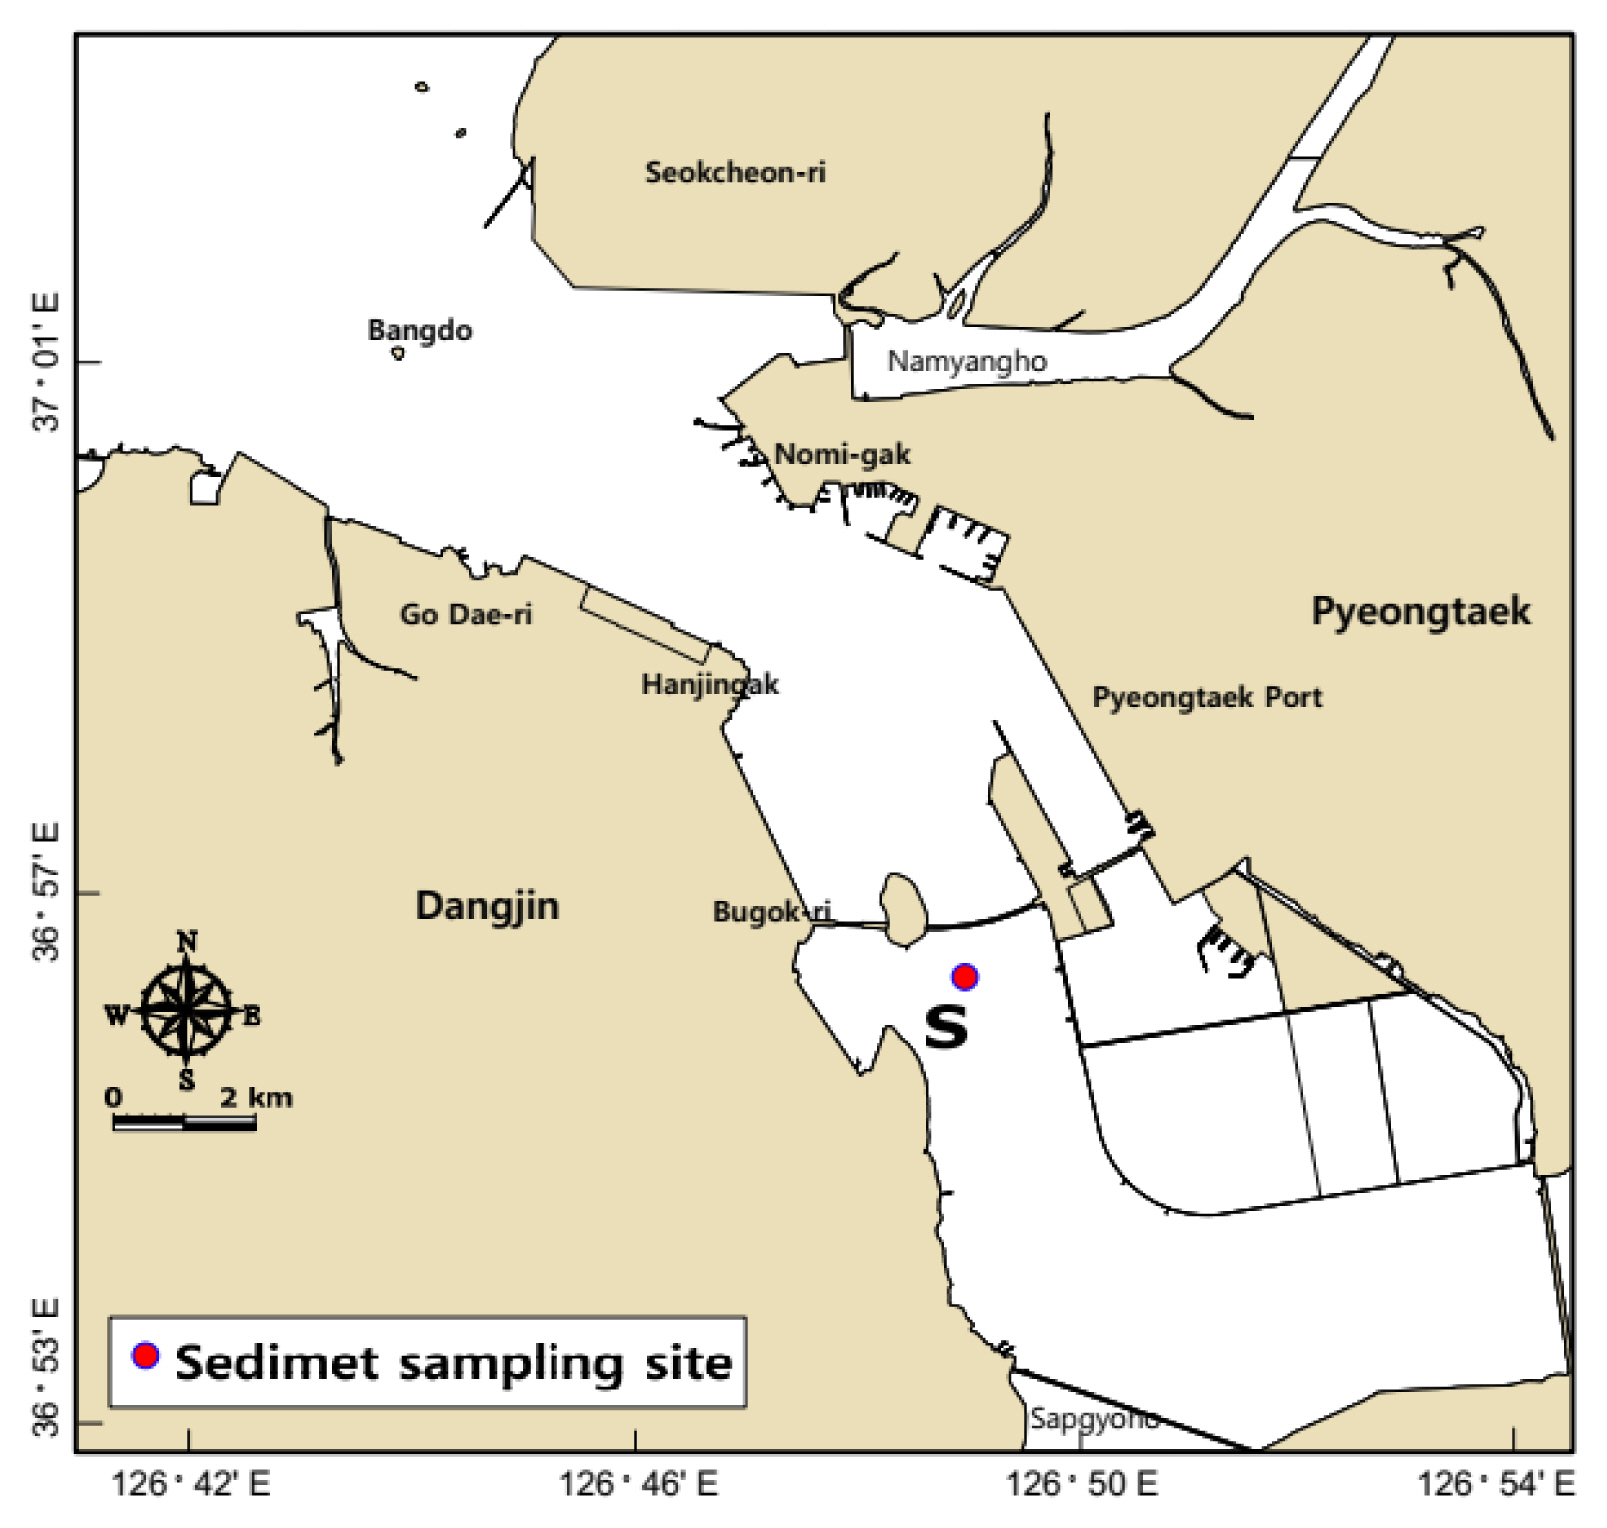
Location map of sediment collection

Properties of sea water used as eroding fluid
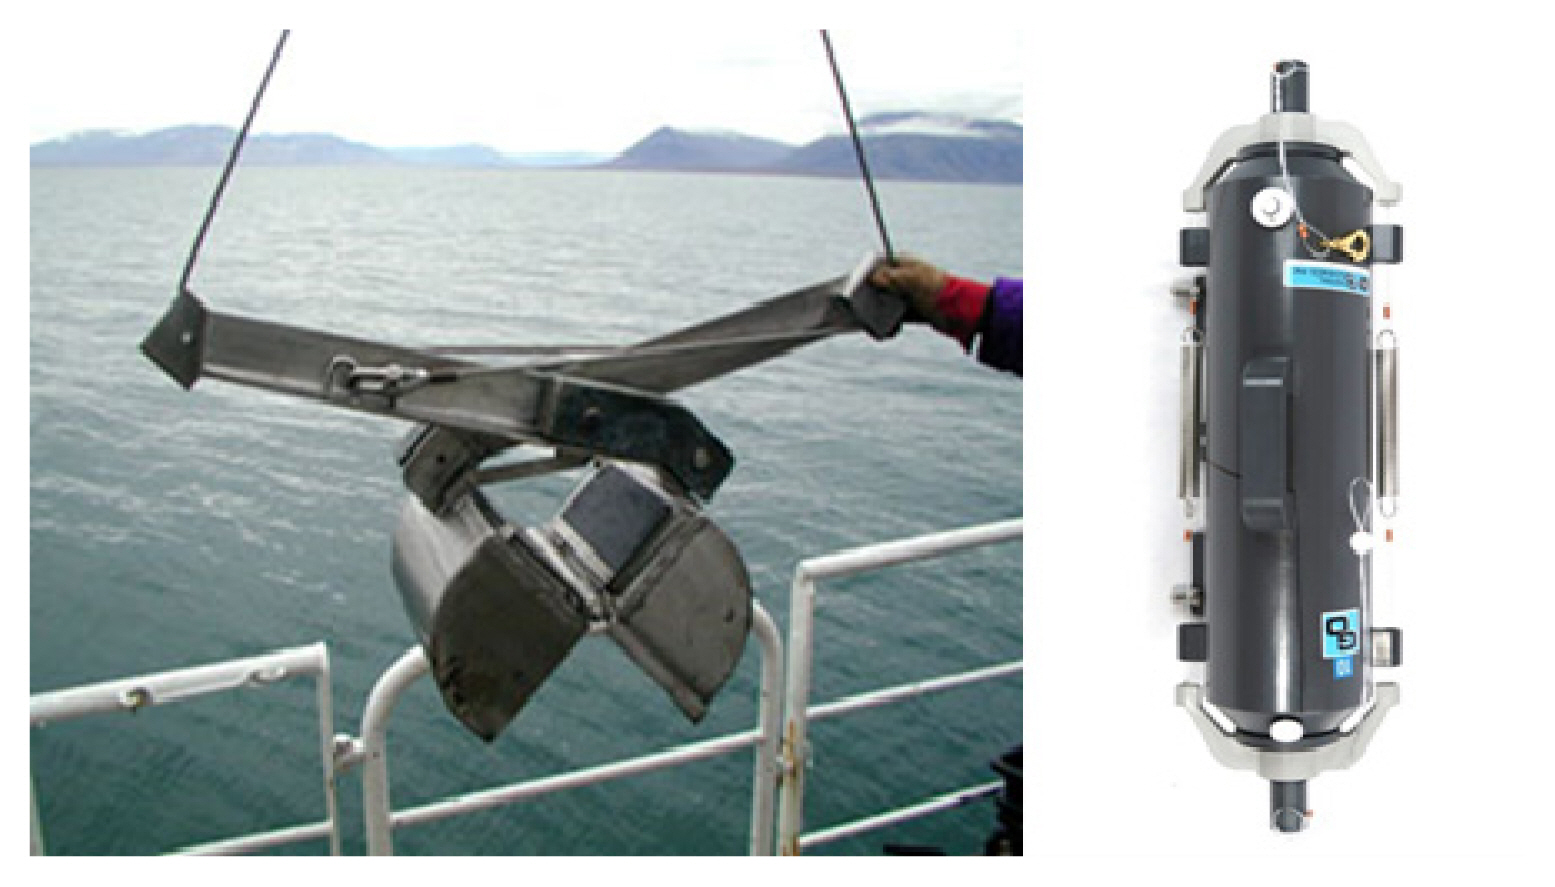
Grab sampler and Niskin water sampler
3. Physico-Chemical Properties of Muddy Sediments
The erosion properties of cohesive sedimentary materials are greatly impacted by the phenomenon of particle cohesion and adhesion (Grabowski et al, 2011). The cohesion between particles, however, varies based on the individual particle’s adhesive strength. Furthermore, this adhesive strength (bonding force) is greatly impacted by the sediment’s fundamental characteristics such as its particle size distribution (Wang et al., 2020), organic matter content (La Manna et al., 2021), mineral composition, and cation exchange capacity (CEC) and can have a significant impact on the porosity, permeability, and water capacity of a soil sample. Therefore, investigating and analyzing these factors are essential basics. In this study, before conducting erosion experiments on sediment samples collected from the Asan Bay area, experiments were conducted to investigate the physico-chemical characteristics of the sediment. The survey items included particle size distribution, organic matter content, cation exchange capacity and mineral composition, and the results obtained were used to analyze the validity of the erosion parameter estimations.
3.1 Grain Size Distribution
Particle size distribution affects the ability of the soil to resist erosion, with larger particles generally providing greater resistance (Urumović & Urumović Sr, 2014). In this study, the grain size distribution was analyzed using a combination of weight sieve analysis and laser diffraction method (Svensson et al., 2022). The grain size distribution measurement results obtained in this study are presented in Fig. 3 and Table 2 along with the grain size distribution results of sediments in the Saemangeum area (Hwang et al., 2008) Shiwa Lake (Tae, 2011), Gunsan area (Yim et al., 2008), and the Okeechobee Lake sediment (Hwang & Mehta, 1989).

Accumulated particle size distribution of the sediments
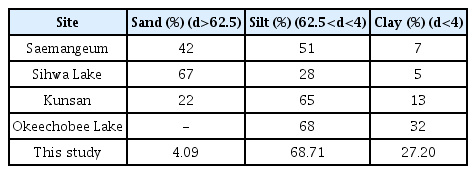
Comparison of grain size content for cohesive sediments
The sand, silt, and clay content vary across different sites with Sihwa Lake having the highest sand content at 67% and Okeechobee Lake having the highest silt and clay content at 68% and 32%, respectively.
The study site has the lowest sand content at 4.09%, while Sihwa Lake has the lowest silt content at 28%. In this case, the high percentage of silt and clay particles would suggest that the soil has a relatively low porosity, since these smaller particles tend to pack more tightly together and leave less pore space. However, the relatively low percentage of sand particles could help to increase the porosity somewhat. These values suggest that the depositional environments at the different sites may vary, with Sihwa Lake likely having a higher energy depositional environment leading to a higher sand content (Webb, 2021), while the study site having a relatively lower energy depositional environment leading to a lower sand content.
3.2 Organic Content
This study analyzed the organic content of sediment in the Asan Bay area using the thermogravimetric method, as outlined by the marine environmental quality test method (Institute, N. F. R. a. D., 1997). Organic matter content can impact soil stability and contribute to better water infiltration, which can help prevent erosion. The resulting data on the organic content of sediment in the Asan Bay area is shown in Table 3, along with data on the organic content of sediment in other regions. Based on the data provided below, it appears that the organic matter content in the sediments from the Saemangeum, Kunsan and this study site is relatively similar, with values of 3%, 3% and 4% respectively.

Comparison of organic contents for cohesive sediments
However, the organic matter content in the sediment from the Sihwa Lake site is higher at 6%. While the sediment from Okeechobee Lake site is significantly higher than all the other sites, with a value of 40%. It suggests that organic matter content in these sediments vary greatly between different locations and the Okeechobee Lake site being significantly higher compared to the other sites.
Additionally, it may indicate that Okeechobee Lake possesses a distinct environment, ecology, or human activities that influence the amount of organic matter present in the sediment.
3.3 Mineral Composition Component
The mineral composition of the samples from the Asan Bay area was quantitatively measured using the X’pert MPD of the Korea Institute of Geoscience and Mineral Resources, and the results are presented in Table 4. Based on the mineral composition data provided, it appears that the sediment in the Asan Bay area is primarily composed of illite (43.0%), with smaller amounts of quartz (29.3%), albite (13.8%), kaolinite (5.0%), and microcline (3.3%).
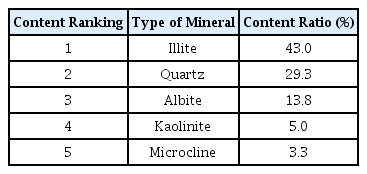
Composition of mineralogical composition
This suggests that the depositional environment was low energy, as illite and kaolinite are commonly found in low energy environments such as shallow marine environments and are formed through the alteration of feldspar minerals. Additionally, the presence of quartz and albite, which are commonly found in sandstones and are resistant to weathering, suggests that this sediment was sourced from nearby land. Overall, this mineral composition is consistent with a low energy depositional environment such as a coastal or shallow marine setting.
3.4 Cation Exchange Capacity (CEC)
Cation Exchange Capacity (CEC) of the muddy sediment was analyzed according to the atomic absorption spectrophotometry (exchangeable cations) by the National Institute of Agricultural Technology in Jeollabuk-do. The result indicates that the capacity of the muddy sediment to exchange cations (positively charged ions) is 15 cmolc/kg. In general, a higher CEC value indicates that the soil or sediment has a higher ability to hold and exchange cations. This can affect the soil’s fertility, water-holding capacity and overall stability. A CEC value of 15 cmolc/kg is considered to be an average value; as natural sediment typically has a CEC value within a range of 10–40 cmolc/kg.
4. Experimental Method and Condition
The erosion experiment was conducted using an annular flume at the Coastal and River Engineering laboratory of Jeonbuk National University. The flume was specially manufactured by (Hwang et al., 2005). Five different experiments were carried out, each with varying densities of uniform beds. The experimental conditions can be found in Table 5.

Experimental conditions in erosion test
In all experiments, the depth of the water layer and the thickness of the bed layer were kept constant at 10 cm and 5 cm, respectively, to allow for more accurate and reliable results, as any changes in the physical properties of the mud sample can be attributed solely to the shear stress and not to other factors such as water level or bed level. The uniform bed surface was created by mixing fine adhesive sediments with seawater collected directly from Asan Bay. The same seawater was used as the eroding fluid in all experiments.
The initial shear stress was set to 0.1 N/m2 and increased stepwise by 0.1 N/m2 in all experiments, reaching a final value of around 0.7 N/m2. Each step of the shear stress was applied for 90 minutes. During these 90 minutes, turbidity samples were collected from different heights of the water column for gravimetric analysis of t he water layer in the tank at 0, 2, 5, 10, 15, 20, 30, 40, 50, 60, 75, and 90 minutes and the average value was used in the analysis of the experimental results. Detailed information on the erosion test method is given in Hwang et al. (2005).
Generally, the erosion rate (ɛ) for a uniform surface is expressed as follows (Ariathurai & Arulanandan, 1978).
where εM is the erosion rate coefficient, τb is the bottom shear stress due to flow, and τce is the critical shear stress or the bed shear strength.
On the other hand, the erosion rate for each given bottom shear stress in the erosion experiment can be expressed as the rate of change of the mass of sediment eroded per unit area with respect to time (t), converted from the change rate of suspended sediment concentration (C) in the total depth (h) by dividing by the unit area,
where ε is the erosion rate, m is the amount of eroded sediment mass per unit bed surface area, and h is the water depth.
This study examined the impact of various uniform bed densities on erosion. The researchers calculated the concentration of suspended sediment in the tank over time for each bed density. As an example, the results for Test #5, where the bed density was 1.37 g/cm3, are shown in Fig. 4. The graph clearly illustrates that the suspended sediment concentration increases in a linear fashion as time progresses during the erosion process.
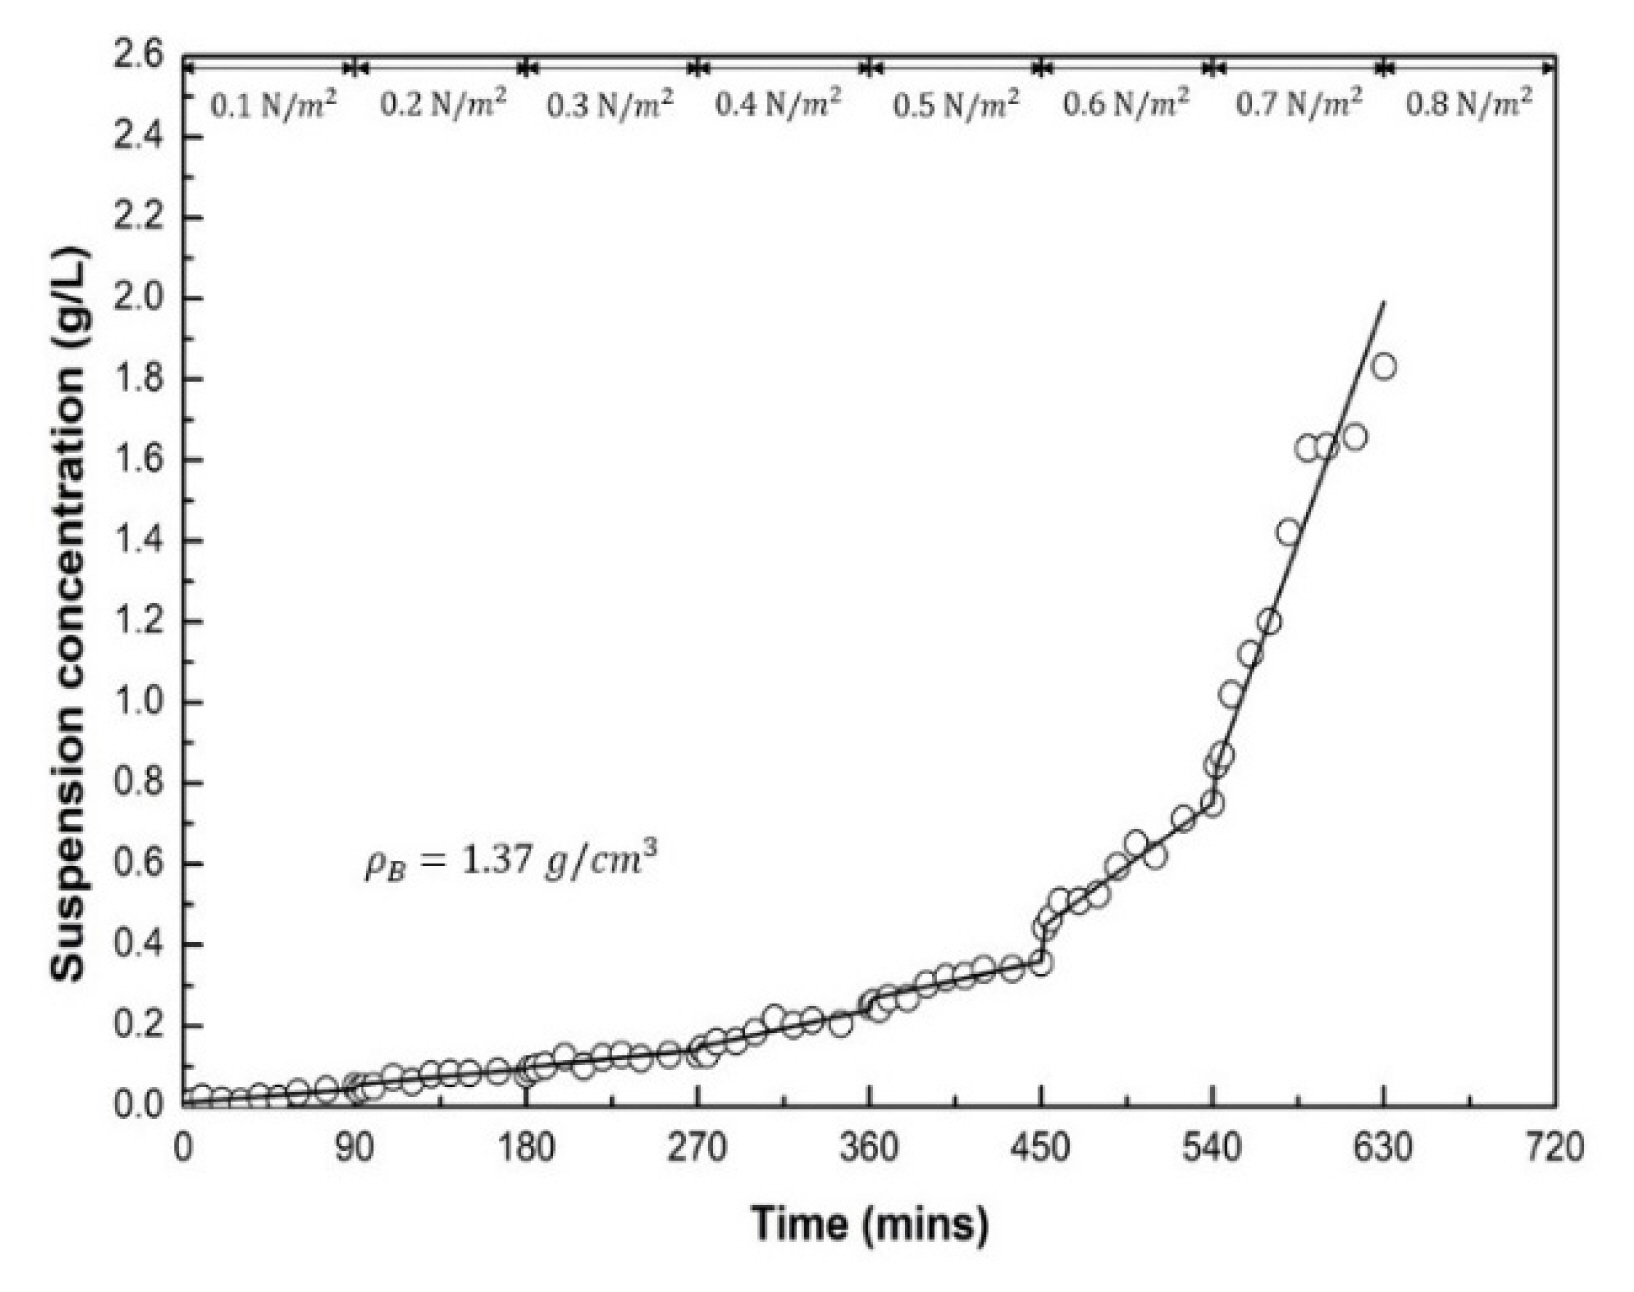
Time-concentration variation (Test #5)
The erosion rate coefficients (ɛ) for the given τb were determined from Equations (1) and (2) and Fig. 4 results. Two fitting curves, K1 and K2, were also calculated and displayed in Fig. 5. K1 represents low bed shear stress erosion of some disturbed surface fluff, while K2 represents relatively high bed shear stress surface erosion. The focus of the study is on surface erosion characteristics, so an explanation of fluff erosion is omitted. The critical shear stress (τce) was calculated by extrapolating K2 to the horizontal axis using the method (Shields, 1936), and the erosion rate coefficient (εM) was found by multiplying the slope of K2 and τce. Fig. 5 shows that when the bed density (ρB) is 1.20 g/cm3, the critical shear stress (τce) is 0.35 N/m2 and the erosion rate coefficient (εM) is 15.54 mg/cm2/hr. Table 6 lists the values of τce and εM for each experiment along with the bulk density values.
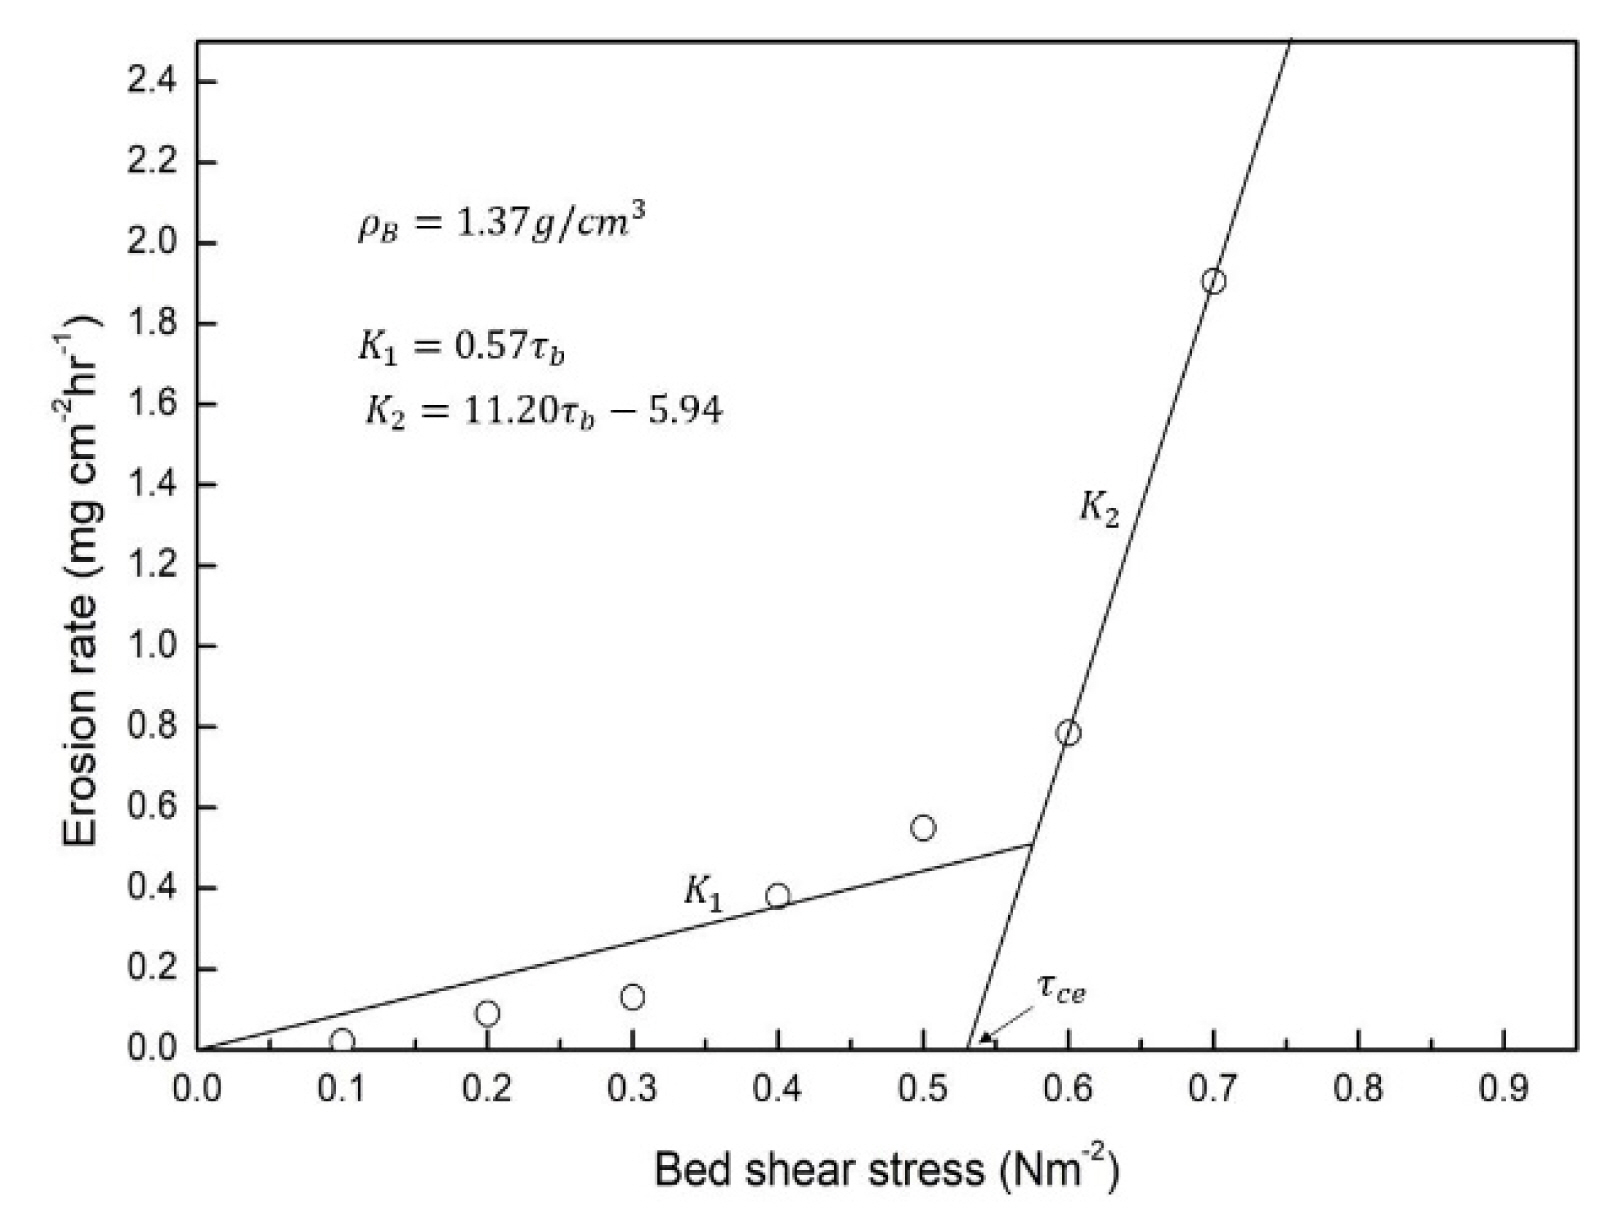
Erosion rate variation with τb for Test #5
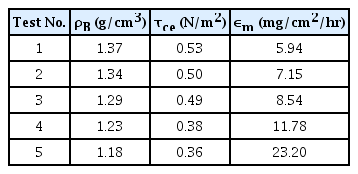
Values of ρB, τce, and εM, for each experiment
5. Erosion Characteristics Analysis
5.1 Influence of Low Bed Density
The impact of bulk density (ρB) on the sediment consolidation was analyzed by examining the relationship between critical shear stress (τce) and erosion rate coefficient (εM) and bulk density (ρB). The results, shown in Fig. 6 and Fig. 7, reveal a strong correlation between τce, εM, and ρB, with an increase in bulk density leading to a logarithmic increase in τce and an exponential decrease in εM.
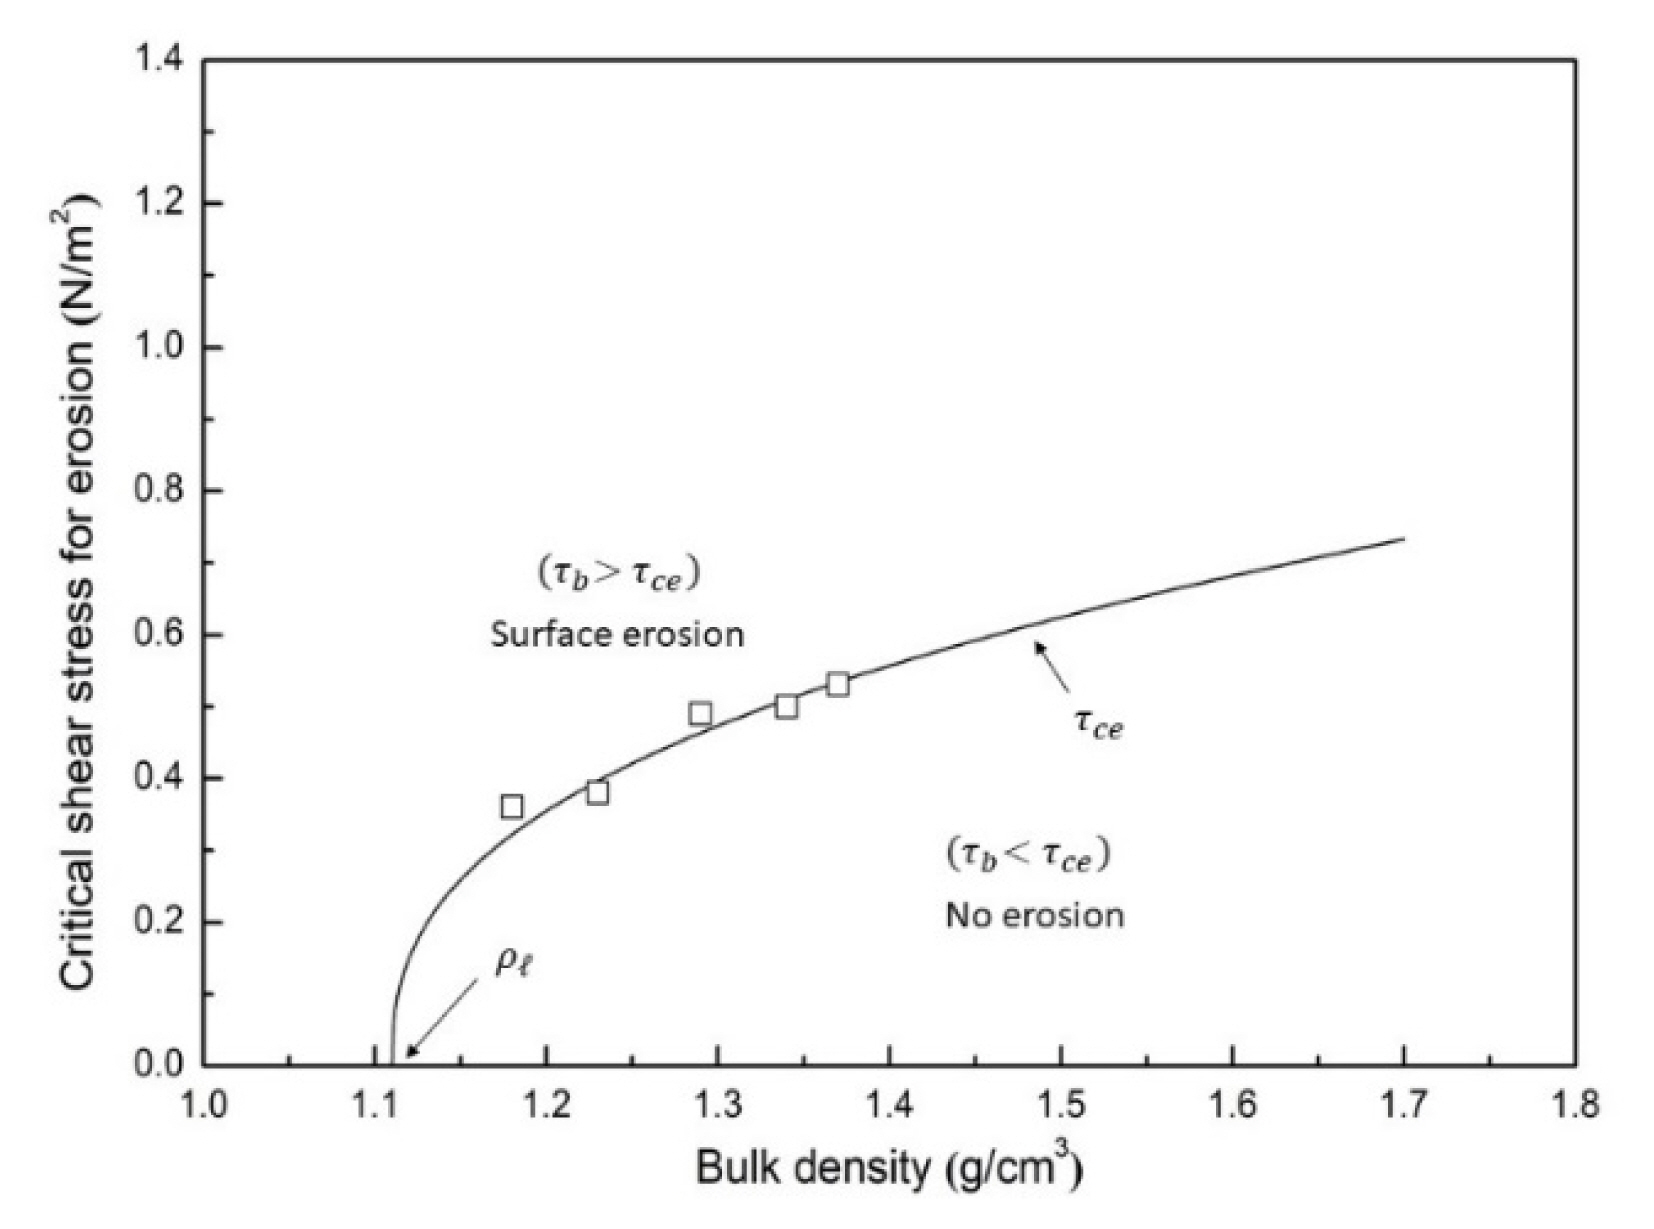
Variation of critical shear stress for erosion, τce with bed bulk density
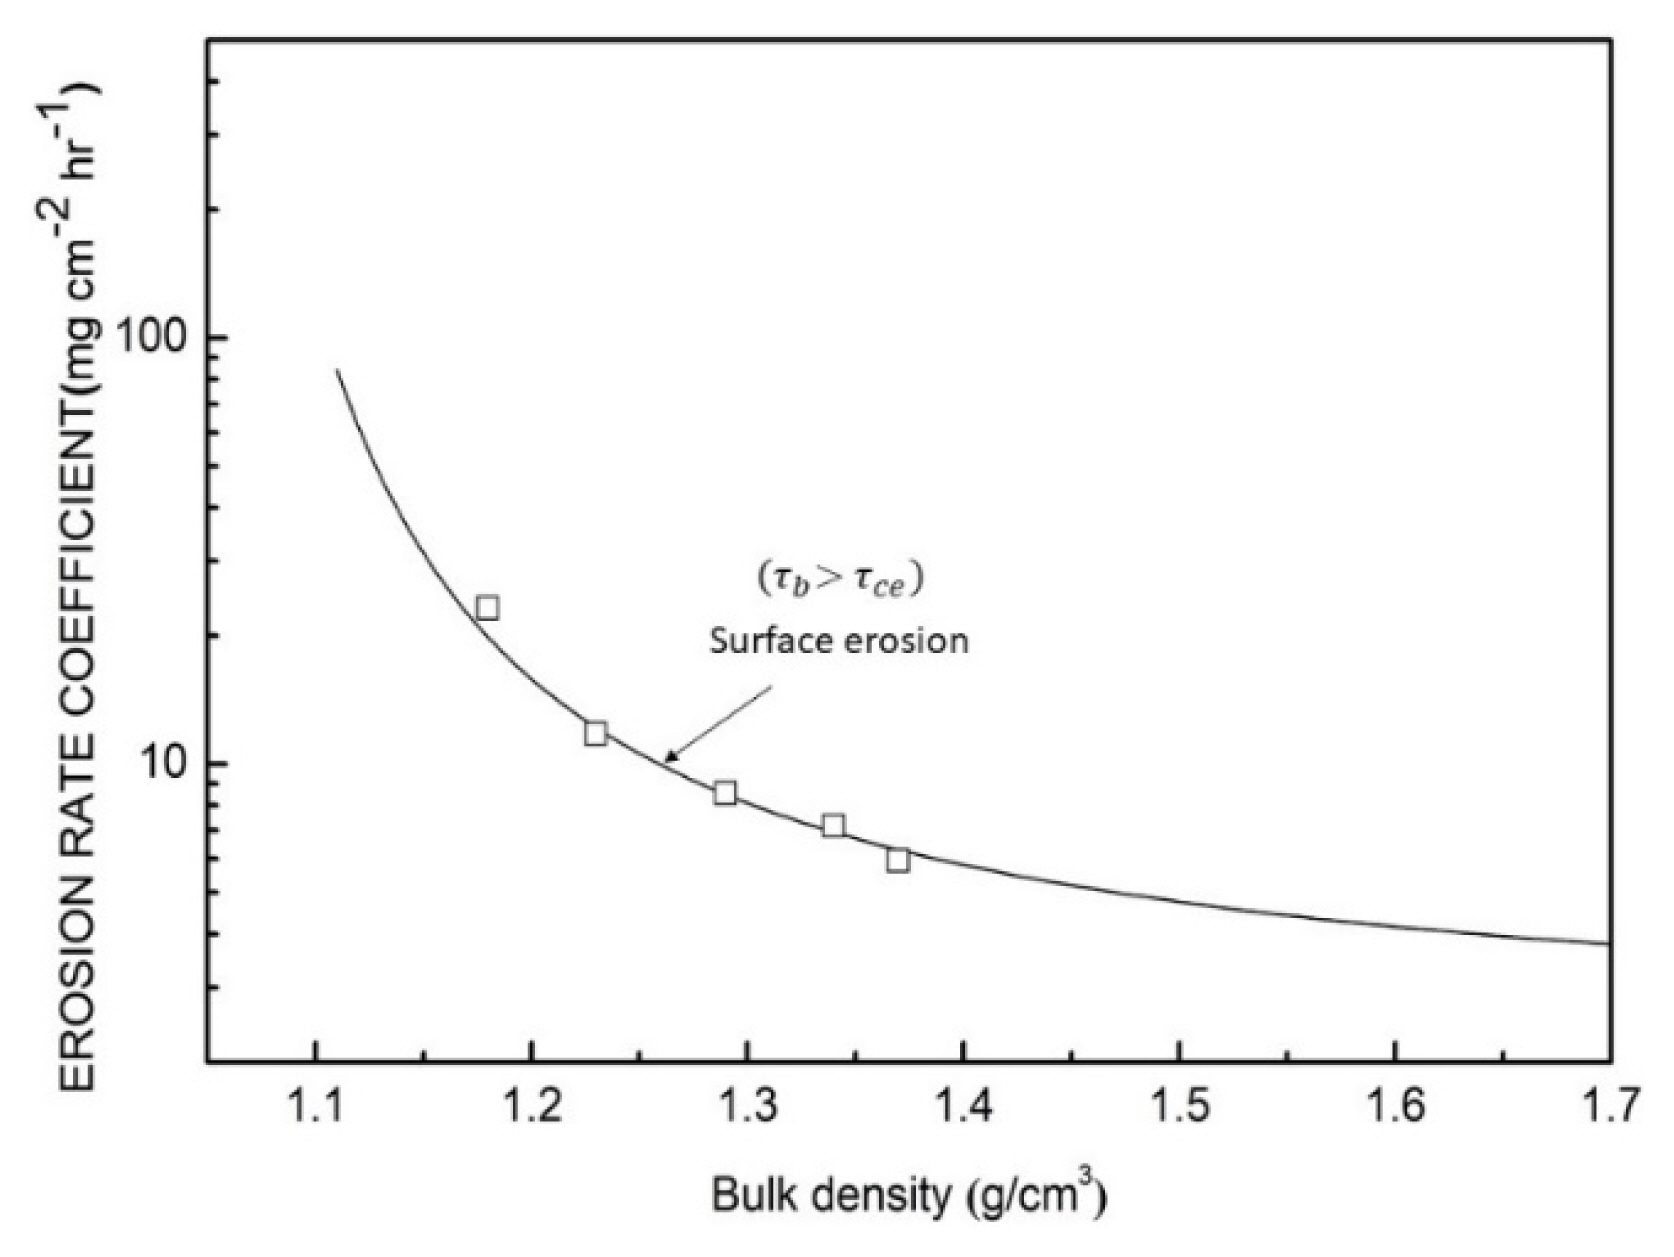
Variation of erosion rate coefficient, εM with bed bulk density
At lower bulk densities, the change in τce and εM is more rapid, while at higher bulk densities the rate of change slows, resulting in a nonlinear trend. The increase in bed density strengthens the cohesion and shear strength of the particles, improving the bed’s resistance to flow and leading to an increase in τce and a decrease in εM. The results of erosion experiments in the Asan Bay are considered credible based on these findings. Equations for estimating τce as a function of ρB and εM were derived using methods from Hwang & Mehta (1989) and Hwang et al. (2005) and given in Eq. (3) and Eq. (4).
Here, aS, bS, cS represents a proportional constant, and ρl a boundary density value between the bottom and the fluid mud layer.
Here, S1 and S2 are proportionality constants, and ρ3 is the boundary density value between the fluid mud layer and erosion water.
The Asan Bay critical shear stress increased in the range of 0.36 to 0.53 N/m2 a s the bulk density c hanged from 1.18 to 1.37 g/cm3. The thickness of the fluid mud layer was determined to be 1.11 g/cm3 based on the optimal fit curve. The equations for the critical shear stress and erosion rate coefficient was calculated using the least square regression method, as shown in Fig. 6 and Fig. 7, respectively. The coefficients a, b, c, S1, and S2, related to the basic properties of the sediment, were estimated to be 0.90, 0.383, −0.003, 2.15, and 0.395, respectively.
5.2 Comparison with the Results of Research on Sediment in Other Areas
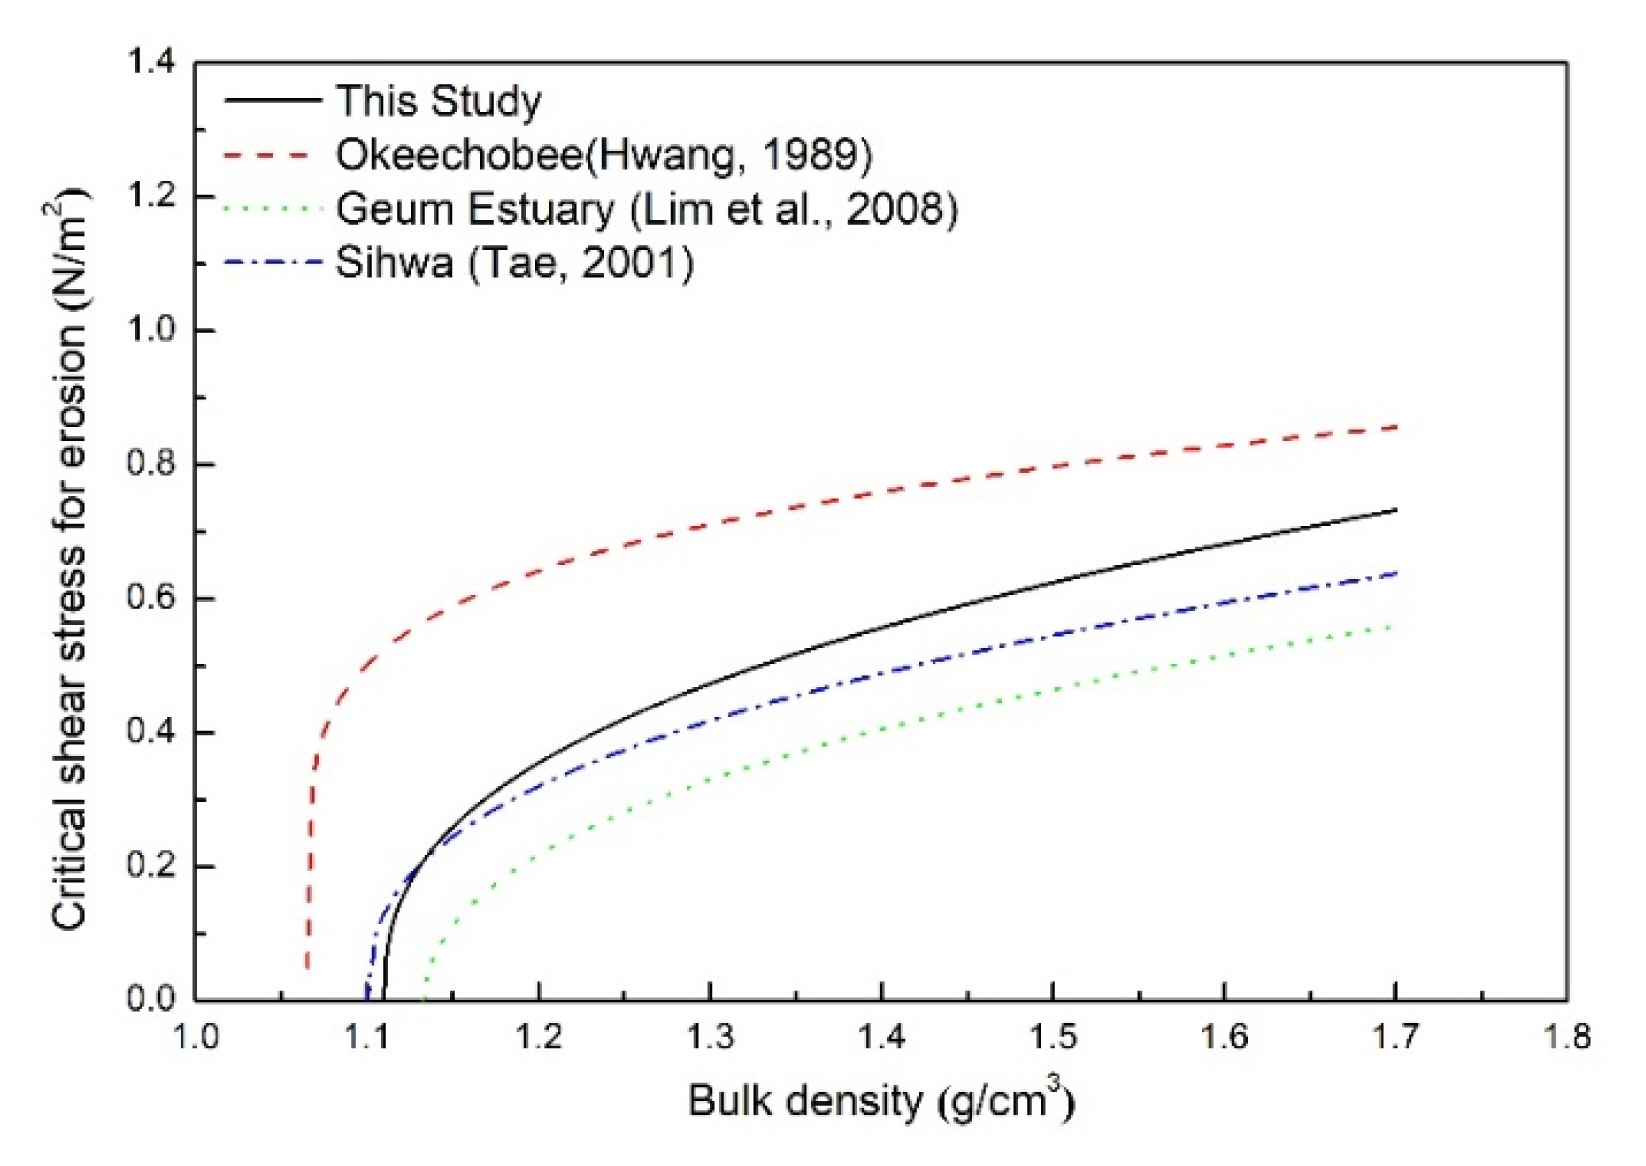
A quantitative analysis of changes in the region was carried out by comparing the results derived from two parameters, τce and εM, which indicate the erosion characteristics of sediments in the Asan Bay area, with the erosion characteristics of sediments from other regions in the past, such as Okeechobee Lake (Hwang & Mehta, 1989), Geum River Estuary (Yim et al., 2008), and Lake Sihwa (Tae, 2011). The erosion characteristic estimations for the S sediments in the Asan Bay area were compared and reviewed with these past regions, and are presented in Fig. 8 and Fig. 9.
Comparison of τce for S sediments with others

Comparison of εM for S sediments with others
Fig. 8 illustrates the critical shear stress, which signifies the maximum stress a sediment can endure before erosion starts, for each region. When comparing these sediments with a reference bulk density of 1.20 g/cm3, the critical shear stress of the sediments in Asan Bay is 0.35 N/m2, which is 8% higher than the critical shear stress of the Sihwa Lake sediment (0.32 N/m2). On the other hand, the critical shear stress of the Geum River estuary sediment (0.22 N/m2) is 57% lower than the Asan Bay sediment and 83% lower than the Okeechobee Lake sediment (0.64 N/m2).
The critical shear stress of a sediment determines its susceptibility to erosion. From the data, Asan Bay and Sihwa Lake have higher critical shear stress values, making them less susceptible to erosion compared to the Geum River estuary. Meanwhile, Okeechobee Lake has the highest critical shear stress value among all regions, making it the least susceptible to erosion.
As Hwang & Mehta (1989) and Hwang et al., (2005) noted, the erosion parameters of critical shear stress (τce) and erosion rate coefficient (εM) show significant differences under the same bed density (ρB). This means that the erosion characteristics of cohesive sediments can vary widely based on the physicochemical properties of the sediment and the fluid involved. Thus, erosion data from other regions cannot be used for numerical experiments predicting the movement of cohesive sediments in a specific area. Repeated field observations or indoor experiments must be conducted in each investigation area to determine the critical shear stress and erosion rate coefficients.
5.3 Correlation with Physico-Chemical Characteristics
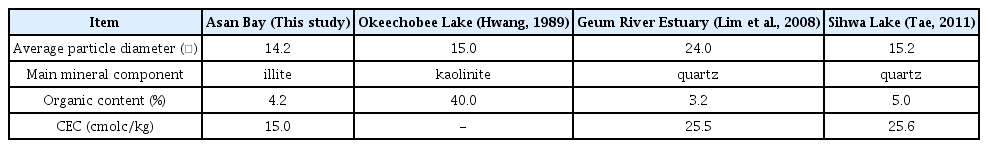
In this study, the causes of regional variations in erosion characteristics were analyzed quantitatively by linking them to the physico-chemical properties of the sediments themselves. The comparison of the physico-chemical properties of each sediment, the average particle diameter, main mineral component, organic content, and cation exchange capacity (CEC) of four different locations as depicted in Fig. 8 and Fig. 9, is summarized in Table 7.
Comparison of physico-chemical properties of Asan Bay sediments with others
As shown in Table 7, the particle diameter of the sediment in these locations is different, with Geum River Estuary having the largest particle diameter (24.0㎛) and Asan Bay having the smallest particle diameter (14.2㎛). This difference in particle diameter can be a result of various factors such as local geology, climate, human activities, and water flow conditions. The average particle diameter is an indicator of the size of the sediment particles in the soil. A larger particle diameter may suggest lower susceptibility to erosion. The main mineral component can have an impact on the soil’s physico-chemical properties, including its erosion resistance. Organic content and CEC are related to the soil’s ability to hold onto nutrients and water, which can also influence erosion resistance.
Compared to the Asan Bay, the other three locations have larger particle diameters, higher organic content, and higher CEC values. These differences suggest that the sediment at these locations may be less susceptible to erosion. The presence of quartz in the Geum River Estuary and Sihwa Lake suggests that these locations may have higher erosion resistance compared to Asan Bay, which is dominated by illite. While data shows the Geum River estuary as the most susceptible to erosion compared to the other 3 regions. It is important to note that these are only general indicators and additional tests and observations may be necessary to make a comprehensive assessment of erosion resistance between these regions.
In conclusion, it is considered impossible to explain the differences in the soil erosion characteristics between the sediments of Asan Bay, Okeechobee Lake, Geum River Estuary, and Sihwa Lake based only on the four items presented in Table 7, such as the average particle diameter, main mineral component, organic content, and cation exchange capacity. To interpret the quantitative differences in soil erosion factors in each region, it is considered necessary to include additional items such as the cohesion coefficient and ionic conductivity, erosion index, total salinity, water and moisture content holding capacity in the survey of the physico-chemical characteristics of the sediment.
6. Conclusion
This study at Jeonbuk National University used a laboratory Annular flume to quantify the erosion properties of cohesive sediments in the Asan Bay region. Five experiments were done on samples from one peak, under different uniform surface conditions and bulk densities. The erosion of cohesive sediments is impacted by its basic physico-chemical properties, so the study looked at these factors and compared the results with those from other areas. When the bulk density changed from 1.18 to 1.37 g/cm3, critical shear stress increases in the range of 0.36 to 0.53 N/m2, while the erosion rate coefficient decreases to the range of 23.20 to 5.94 mg/cm2/hr as the density increases.
The results, shown in Fig. 5 and Fig. 6, reveal a strong correlation between τce, εM, and ρB, with an increase in bulk density leading to a logarithmic increase in τce and an exponential decrease in εM. At lower bulk densities, the change in τce and εM is more rapid, while at higher bulk densities the rate of change slows, resulting in a nonlinear trend. The increase in bed density strengthens the cohesion and shear strength of the particles, improving the bed’s resistance to flow and leading to an increase in τce and a decrease in εM. The results of erosion experiments in the Asan Bay area are considered credible based on these findings.
The results from this study can be used for future numerical models on water quality and sediment transport in the Asan Bay region. However, sediment erosion has “site-specific” characteristics, so repeated field observations or indoor experiments are necessary to accurately determine the erosion parameters for each surveyed area, as noted by Hwang et al. (2005) and Ryu et al. (2006).
Acknowledgment
This research was supported by Korea Institute of Marine Science & Technology Promotion (KIMST) funded by the Ministry of Oceans and Fisheries (RS-2023-00256687).